


Step 1: Set up Log Drain
Supabase allows you to configure a Log Drain that pushes logs to an OpenTelemetry (OTLP) HTTP endpoint that the pganalyze collector exposes.
Log Drains require the Supabase Pro plan or higher.
Expose an OpenTelemetry endpoint on the collector
The pganalyze collector can receive logs over OTLP using the
db_log_otel_server setting.
[pganalyze]
api_key = your_pga_organization_api_key

[server1]
db_host = aws-0-your-region.pooler.supabase.com
db_port = 5432
db_username = pganalyze.your-project-ref
...
db_log_otel_server = 0.0.0.0:4318
Supabase’s infrastructure needs to reach this endpoint over the public internet, so keep the following in mind:
- Run the collector somewhere with a stable, publicly reachable address (a small VM works well)
- We highly recommend running the collector behind a TLS-terminating reverse
proxy or load balancer in front of the
db_log_otel_serverport to provide ahttps://endpoint URL - The collector’s OTLP receiver does not itself authenticate incoming requests, so restrict network access to it (e.g. via firewall/security group rules) wherever possible
Add the Log Drain in Supabase
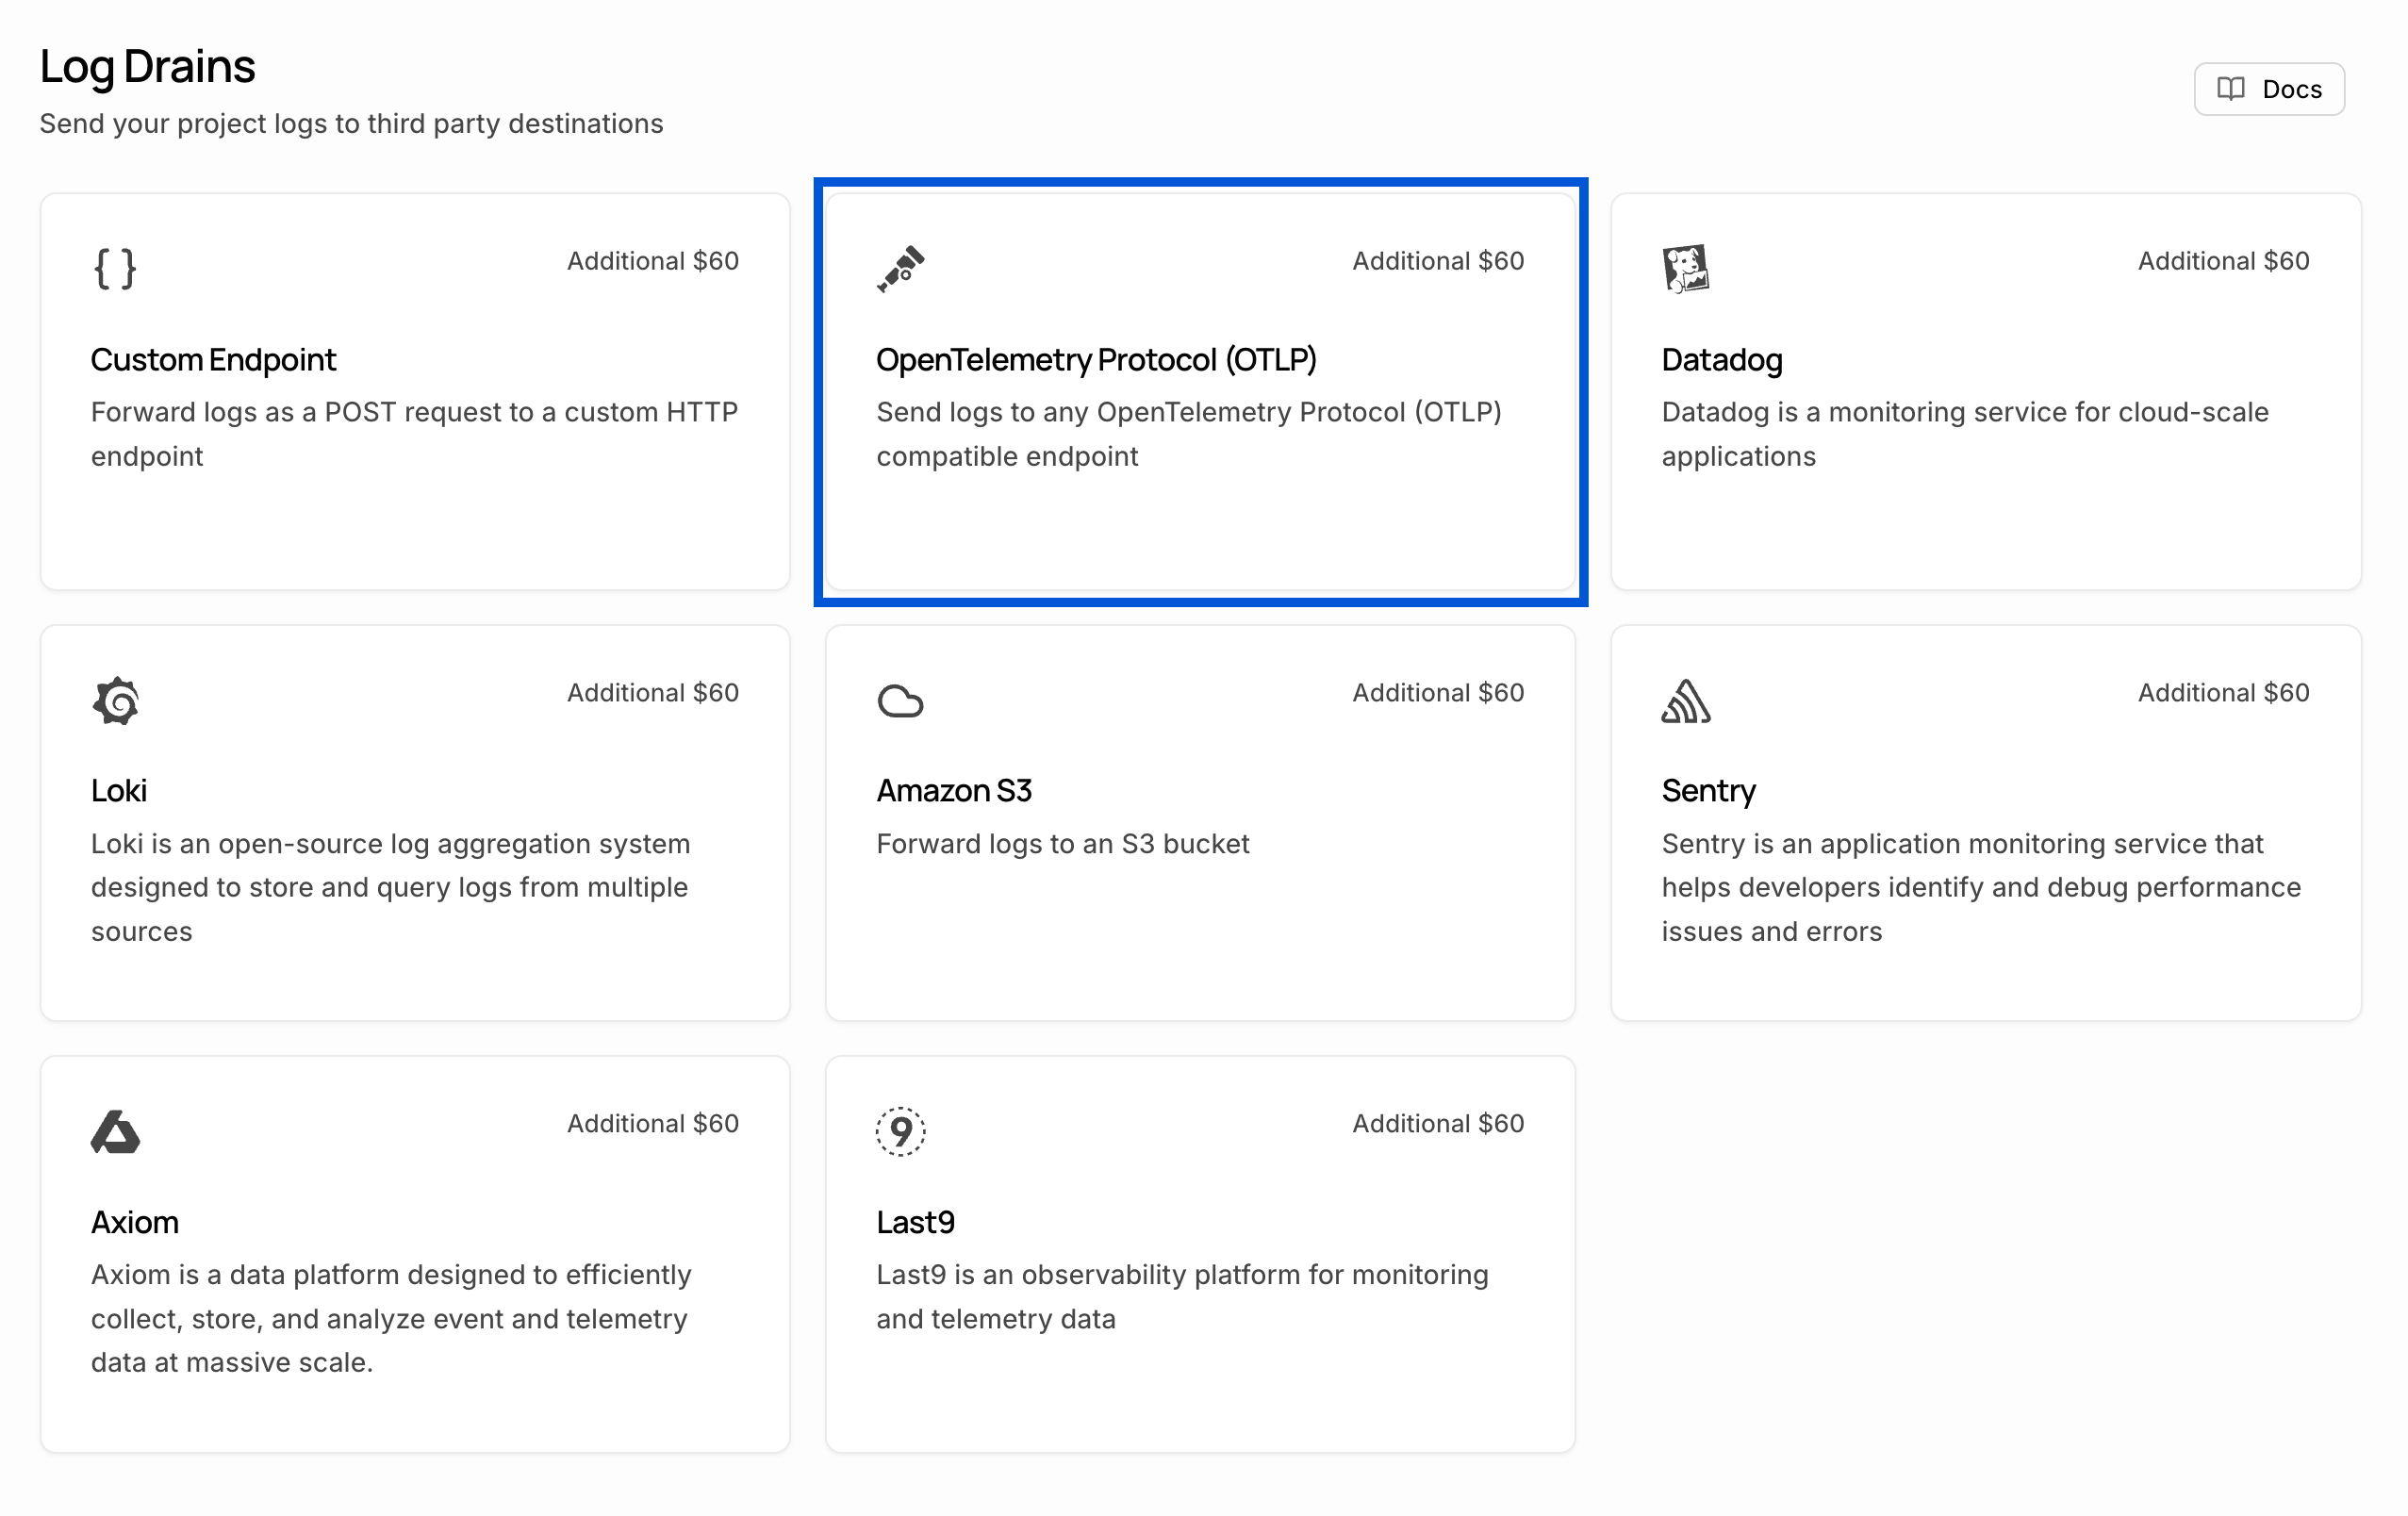
In the Supabase dashboard, go to Project Settings → Log Drains and add a new drain with the Add Destination button:
- Name: pganalyze
- Type: OpenTelemetry Protocol (OTLP)
- Endpoint:
https://your-collector-host:4318/v1/logs - Gzip: enabled (recommended, and supported by the collector)
- Headers: none required — the collector does not check authentication headers
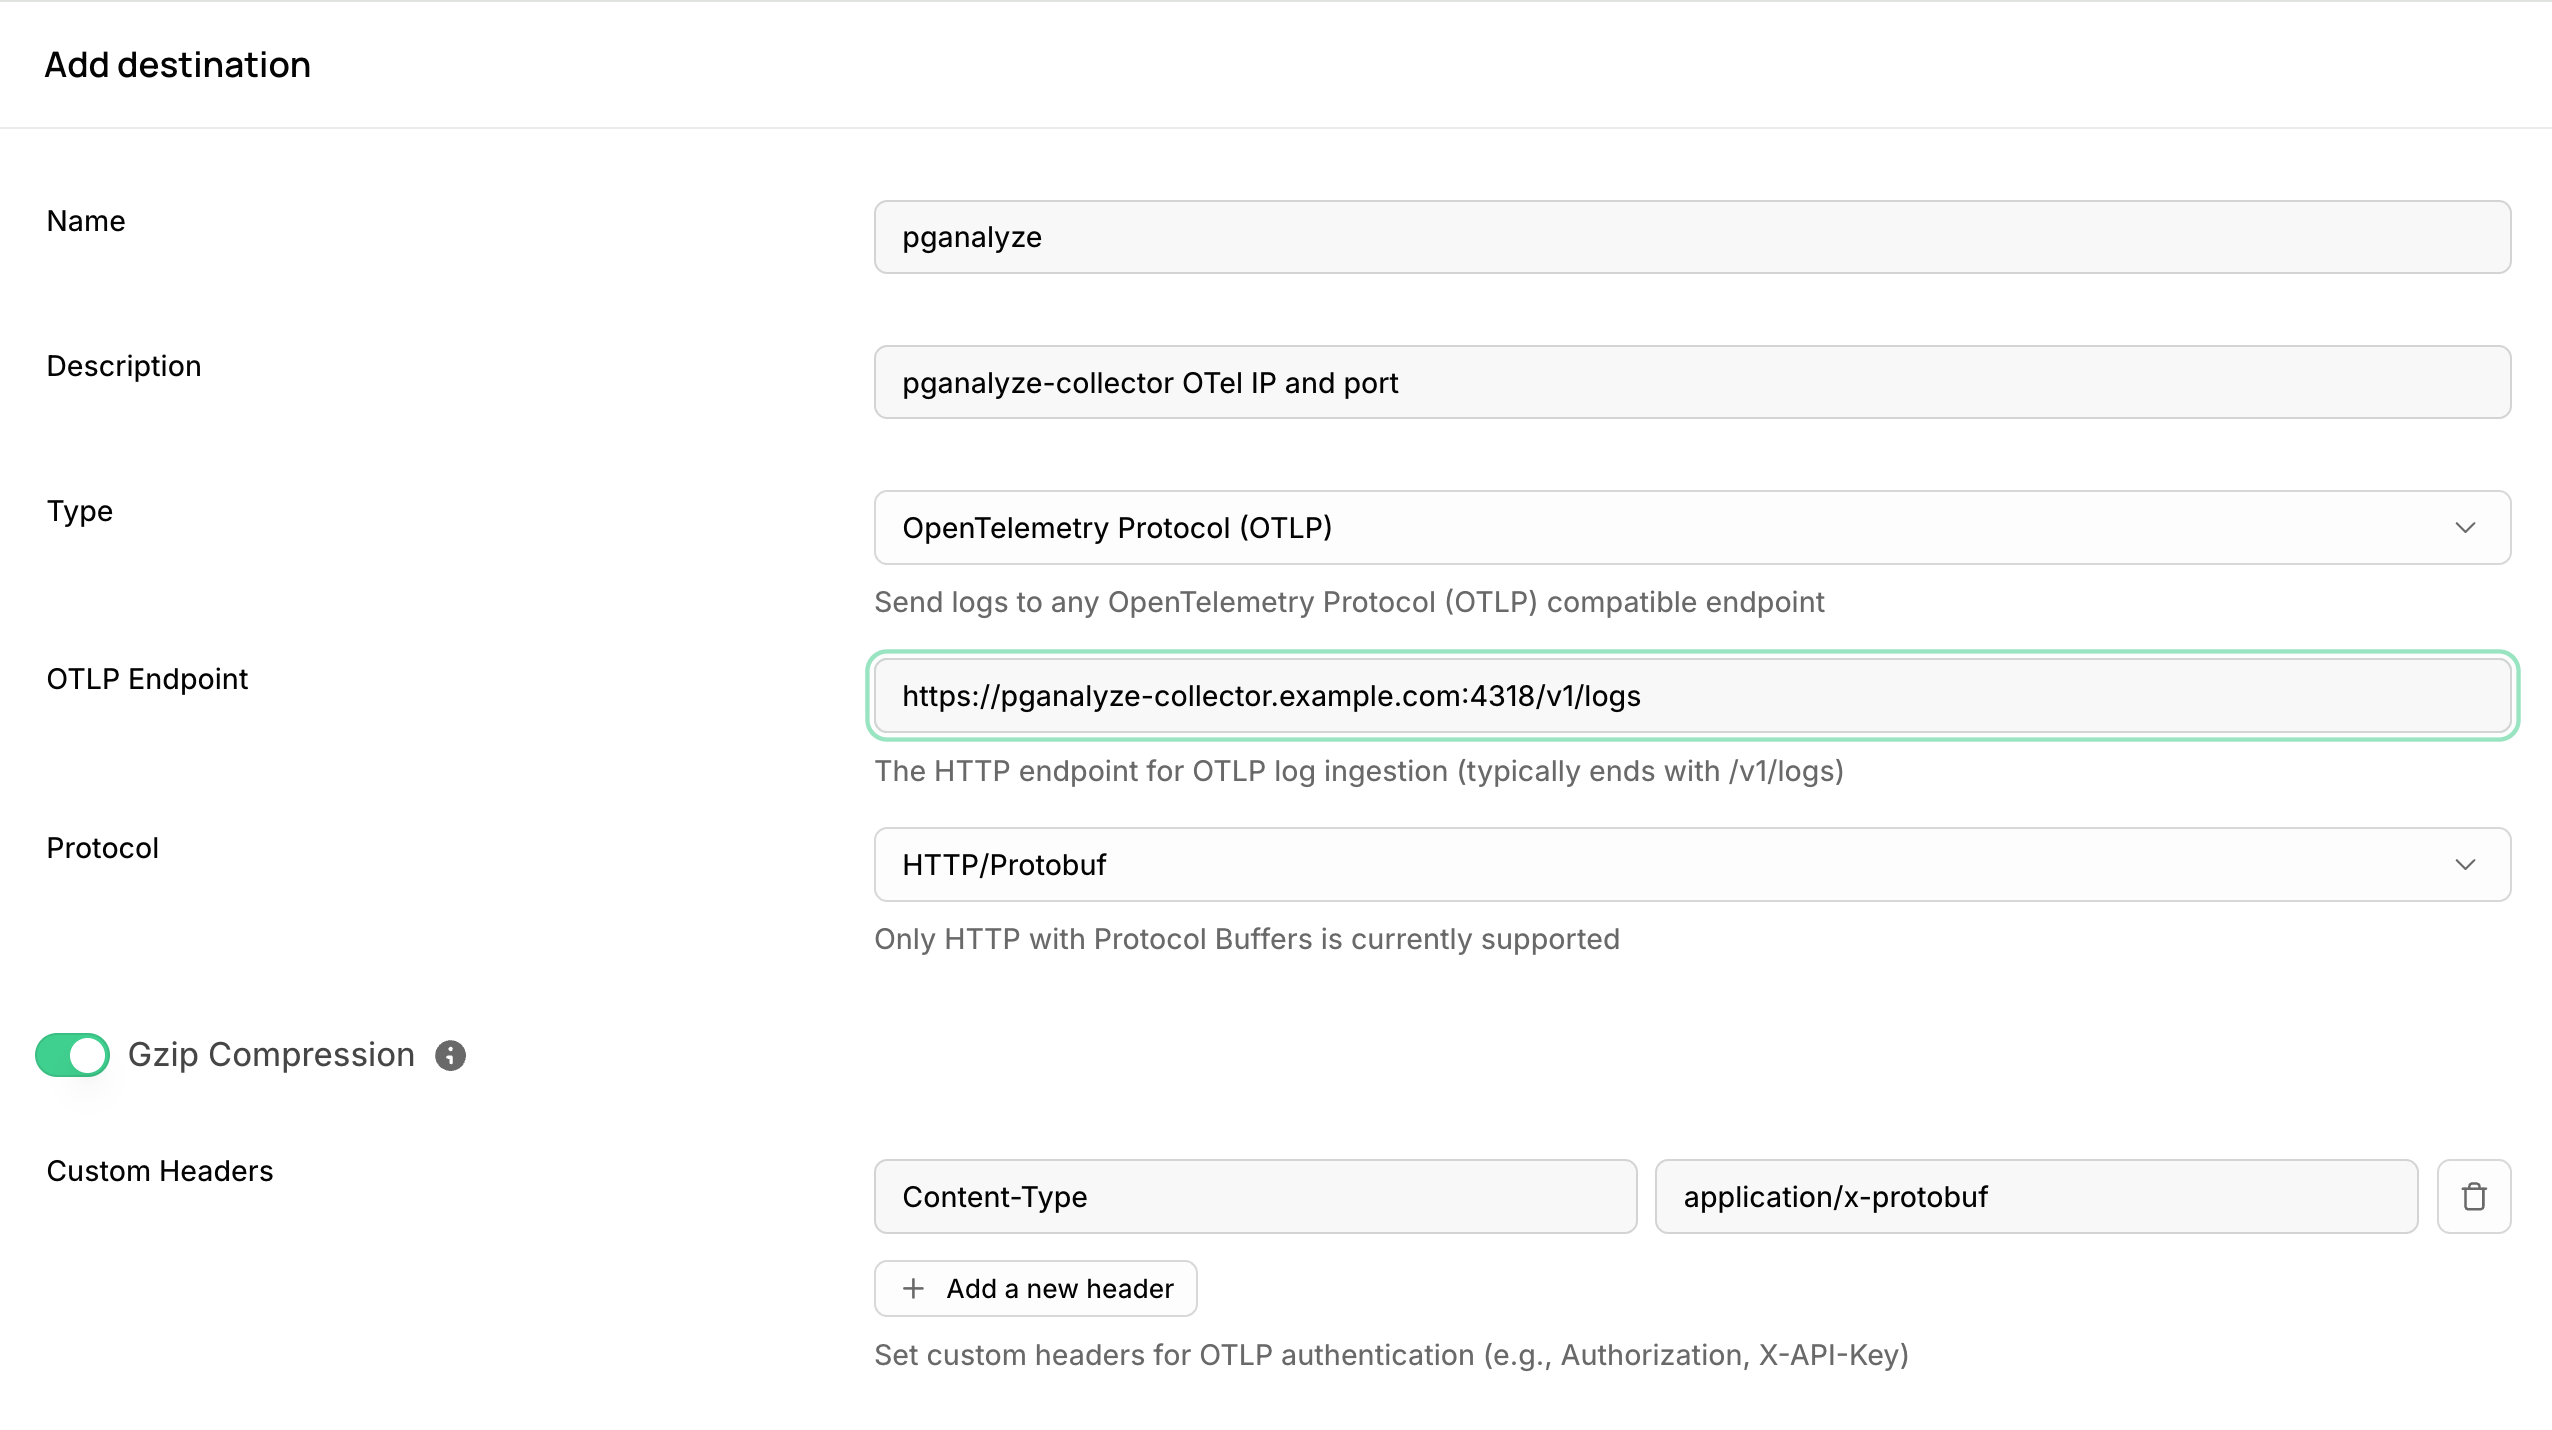
Supabase sends logs for all of its services (Postgres, Auth, Storage, Edge Functions, etc.) to the same drain. The collector only extracts the Postgres log lines and ignores the rest.
Test and verify
Run the following on the collector host to verify the configuration:
sudo pganalyze-collector --test-logs --reloadBecause Supabase batches and pushes logs on a delay, the collector waits longer than usual
for the test log line to arrive (30 seconds by default for Supabase, configurable with
db_log_test_timeout). A successful run ends with
Log test successful.
If logs don’t show up within a few minutes of a real query, double check that the Log Drain is enabled and pointed at the correct endpoint, and that the collector host is reachable from the public internet.
Once ready, you will see log events on the Log Insights page in pganalyze.
We recommend setting up Automated EXPLAIN as a follow-up step, to automatically EXPLAIN slow queries in Postgres.
Couldn't find what you were looking for or want to talk about something specific?
Start a conversation with us →